Hate Across the World: A Collaborative Effort in Data Collection and Reflection

A Brief Introduction
This document contains a series of visualizations about hate victimization cases in different countries. The data is collected within the framework of our project called Crossing Borders, Confronting Bias – Researching Culturally Competent Care for Minorities and Marginalized Groups Through the Eyes of Early Career Students.
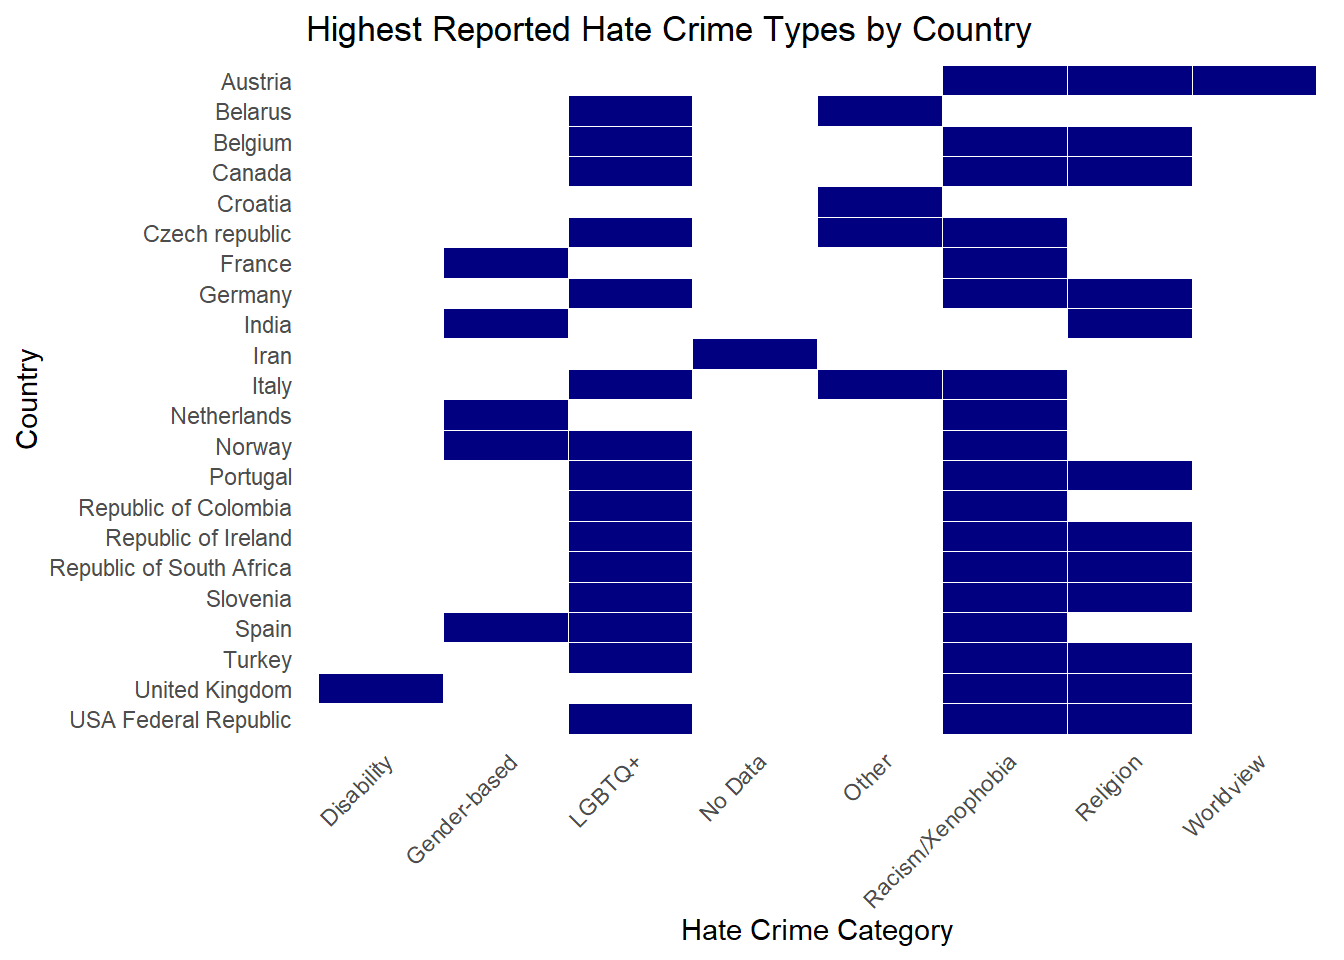
Top 3 reported hate crime types in each country
This plot shows the three highest reported hate crime types in the countries in relatively broad conceptual categories.
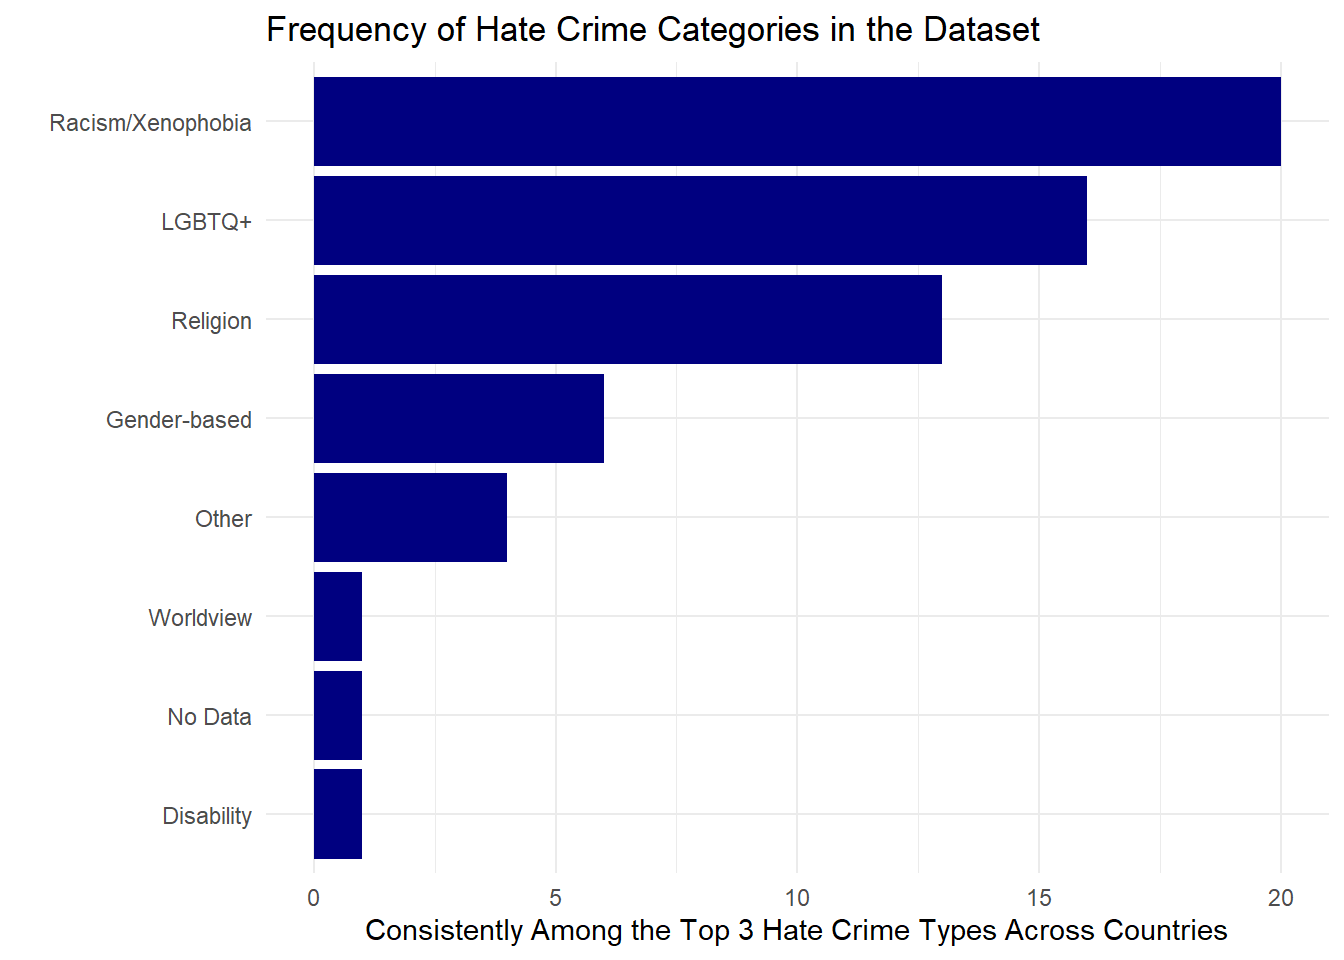
Frequency of Hate Crime Categories in the Dataset
This plot is a continuation of the previous one. It shows what types of hate crimes were most frequently reported as the top three categories in the countries. As we can see, racism and xenophobia are the leading category, followed by LGBTQ+ related hate crime and religious hate crime.
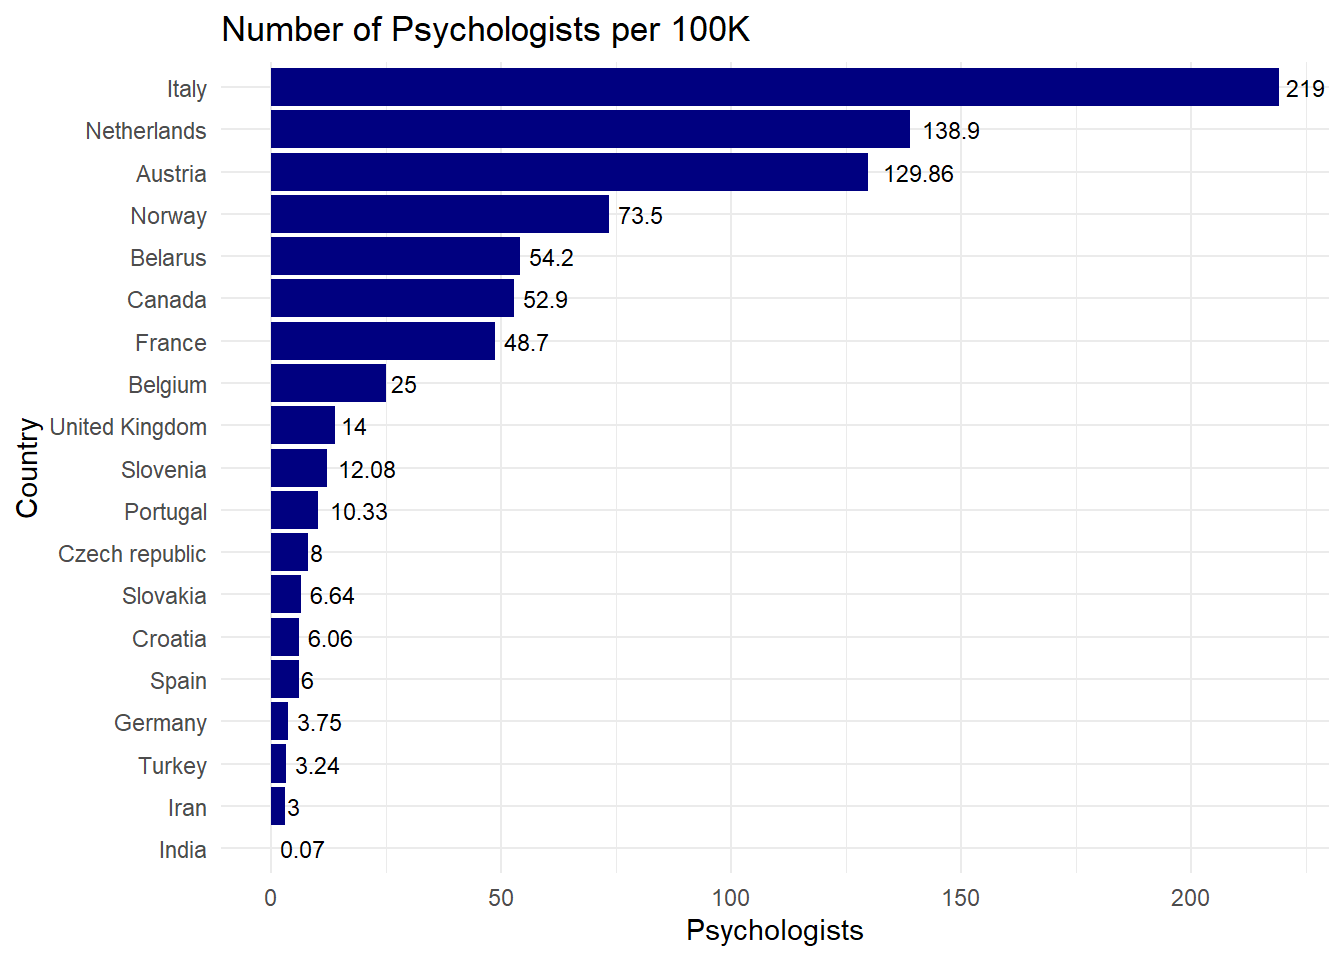
Psychologists needed!
The plot below shows how many psychologists are active per 100k population in each country. India, as expected due to its population, has the lowest ratio of psychologists. Iran is the second to last after Turkey and Germany, which is in urgent need of psychologists. Recently, there have been demands for a reform in the psychology training system of the country.
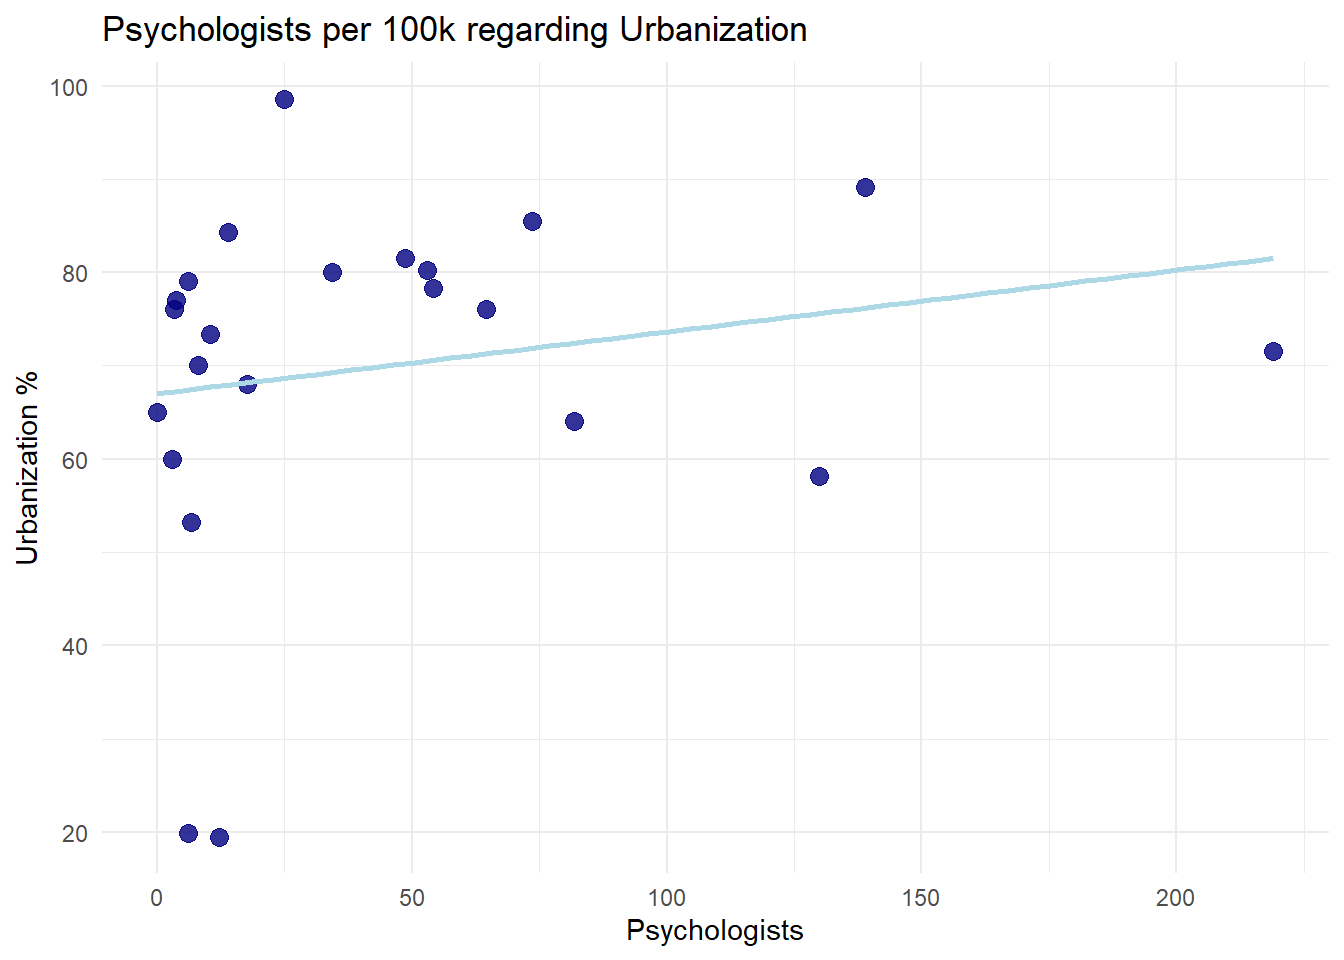
Urbanization and psychologists
We can expect that with an increase in the ratio of urbanization, which can be an indicator of development, the number of psychologists will increase as well. As you can see in the data, there is not a strong relationship between the number of psychologists and how urbanized the country is (r = 0.20). The low correlation indicates that there are more important factors feeding into the lack of psychologists in different countries, such as the educational system, cultural values, economic status, etc.
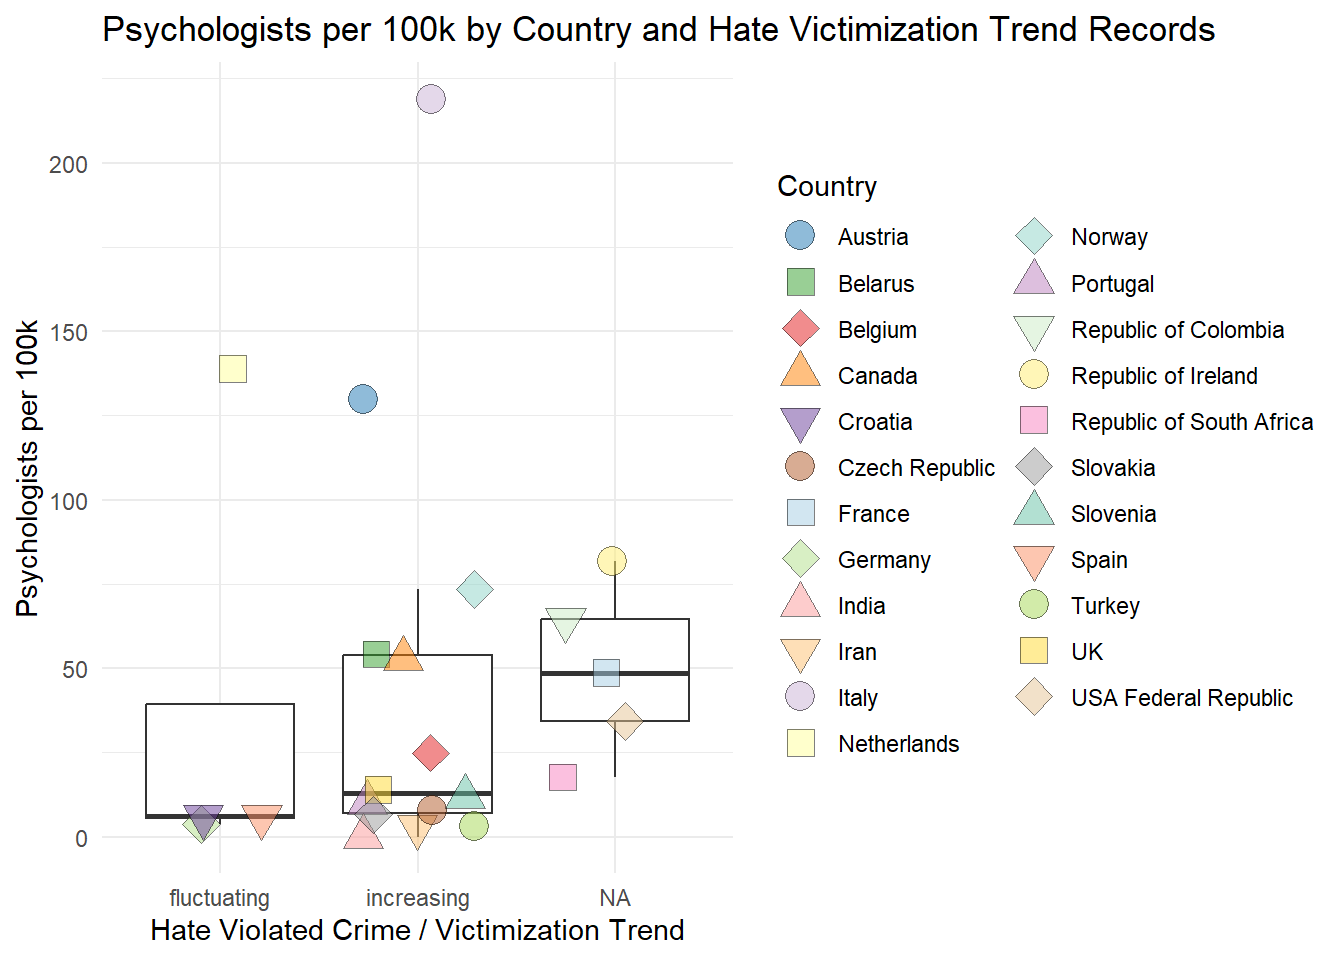
Hate victimization trend and psychologists
In this plot, we see the overall distribution of psychologists per 100k based on the victimization trend in each country. What we can learn from the plot is that, first of all, unfortunately, the trend is increasing in most of the countries. Second, a low number of psychologists doesn’t always mean an increase in hate victimization. Third, countries that have an increasing trend have more psychologists than other countries in most cases. It reflects the importance of creating groups of experts from different fields to solve this multidimensional problem and not relying only on psychologists. The bad news is that we couldn’t find decreasing trends in the countries we collected data from. This can also be an indicator of better data communication and hate vicimization cases being recognized.
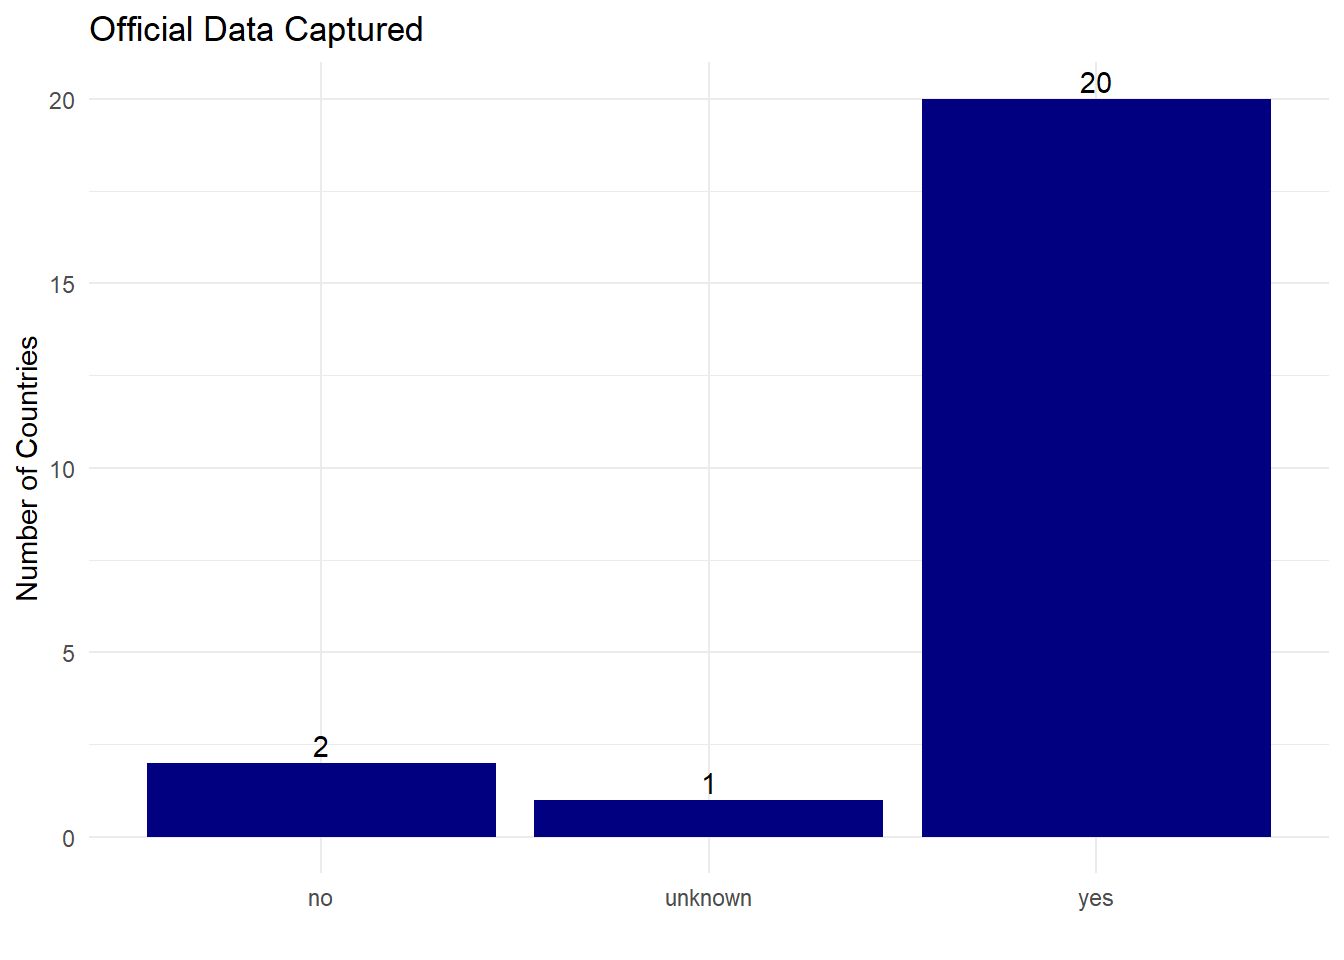
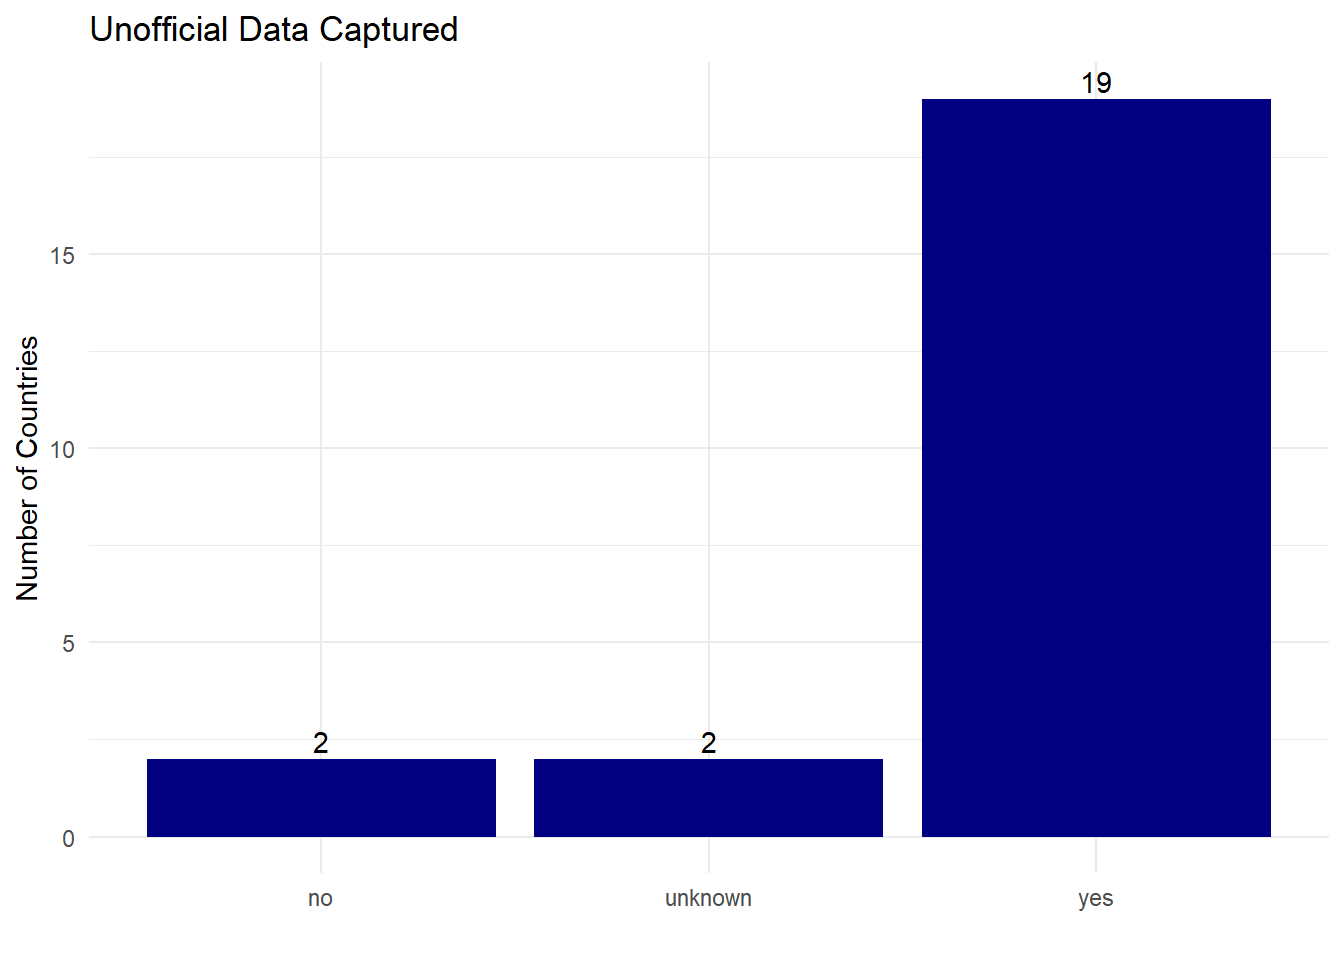
Official vs. unofficial data sources
A huge challenge for gathering this data was the credibility of the sources. Many countries are not very transparent about the hate crime data. In order to capture the data we wanted, we had to refer to unofficial sources as well and cross-validate them. Here is a plot comparing the unofficial and official source numbers. As illustrated in the plot, most of the data is gathered using both ways.
Hate crimes in the countries with more transparent data
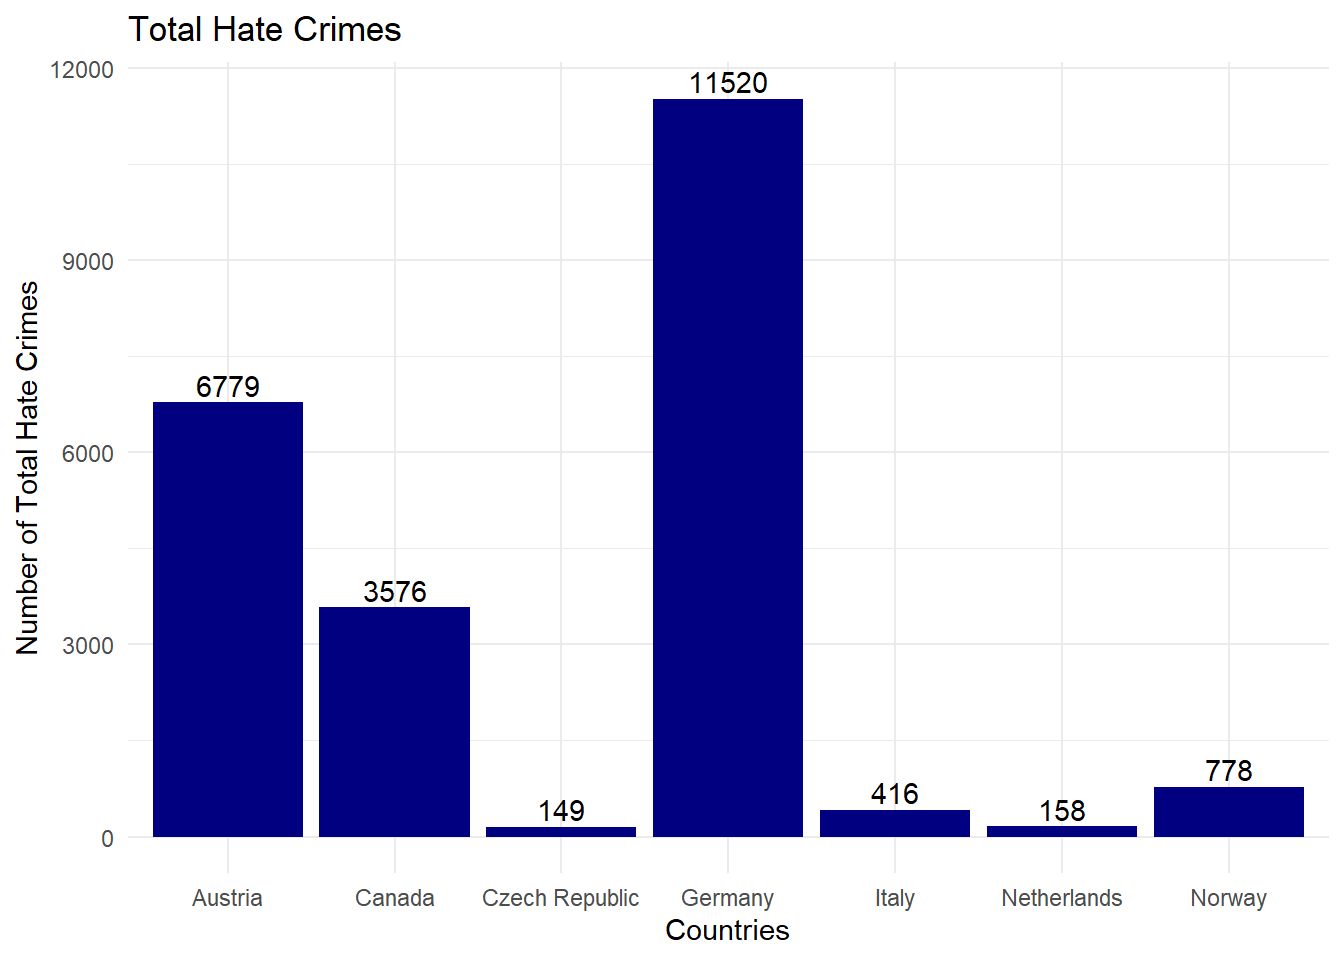
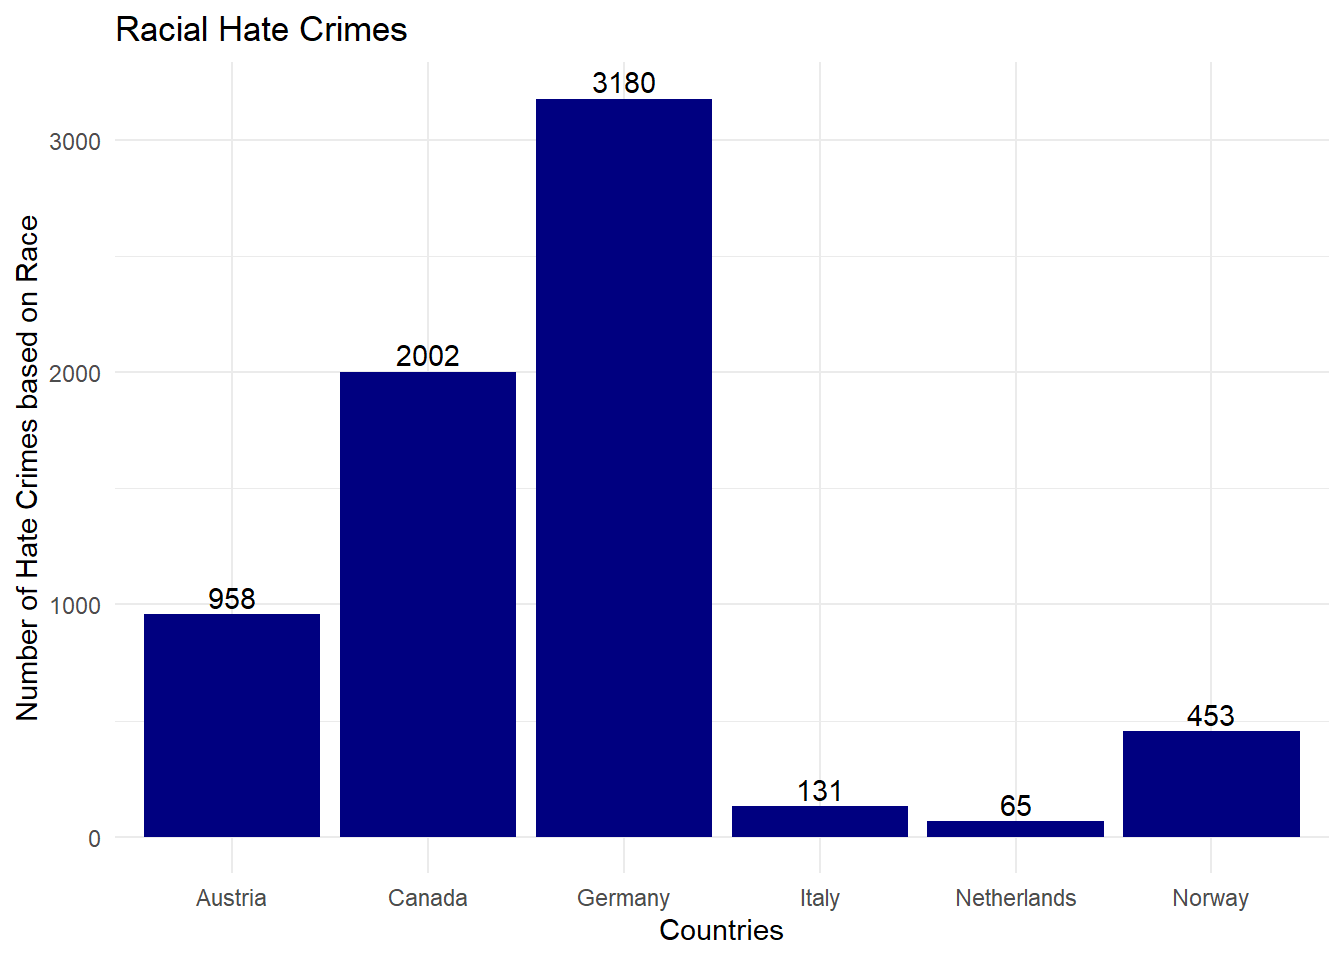
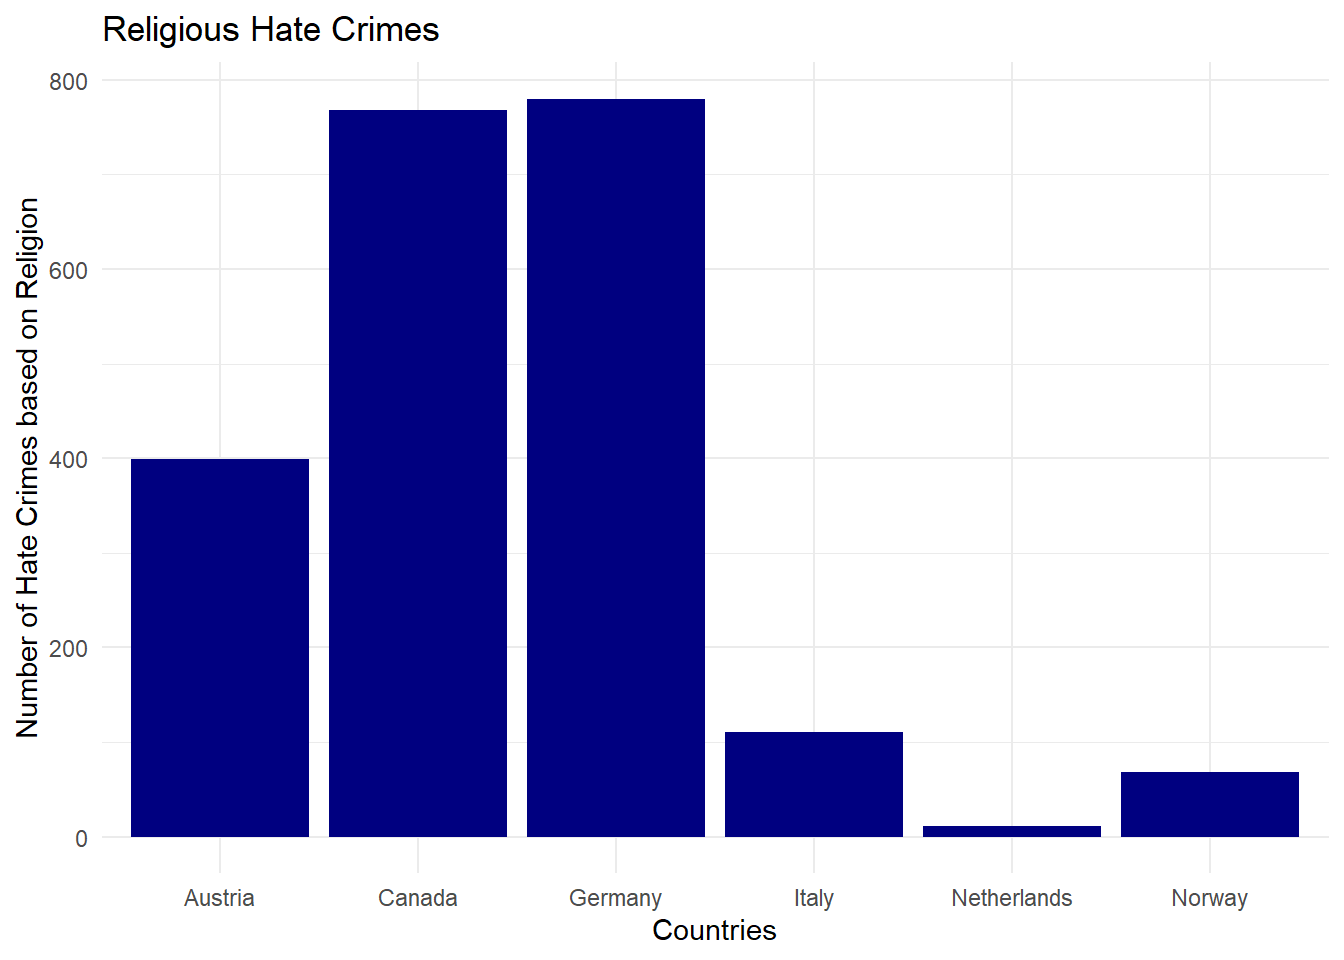
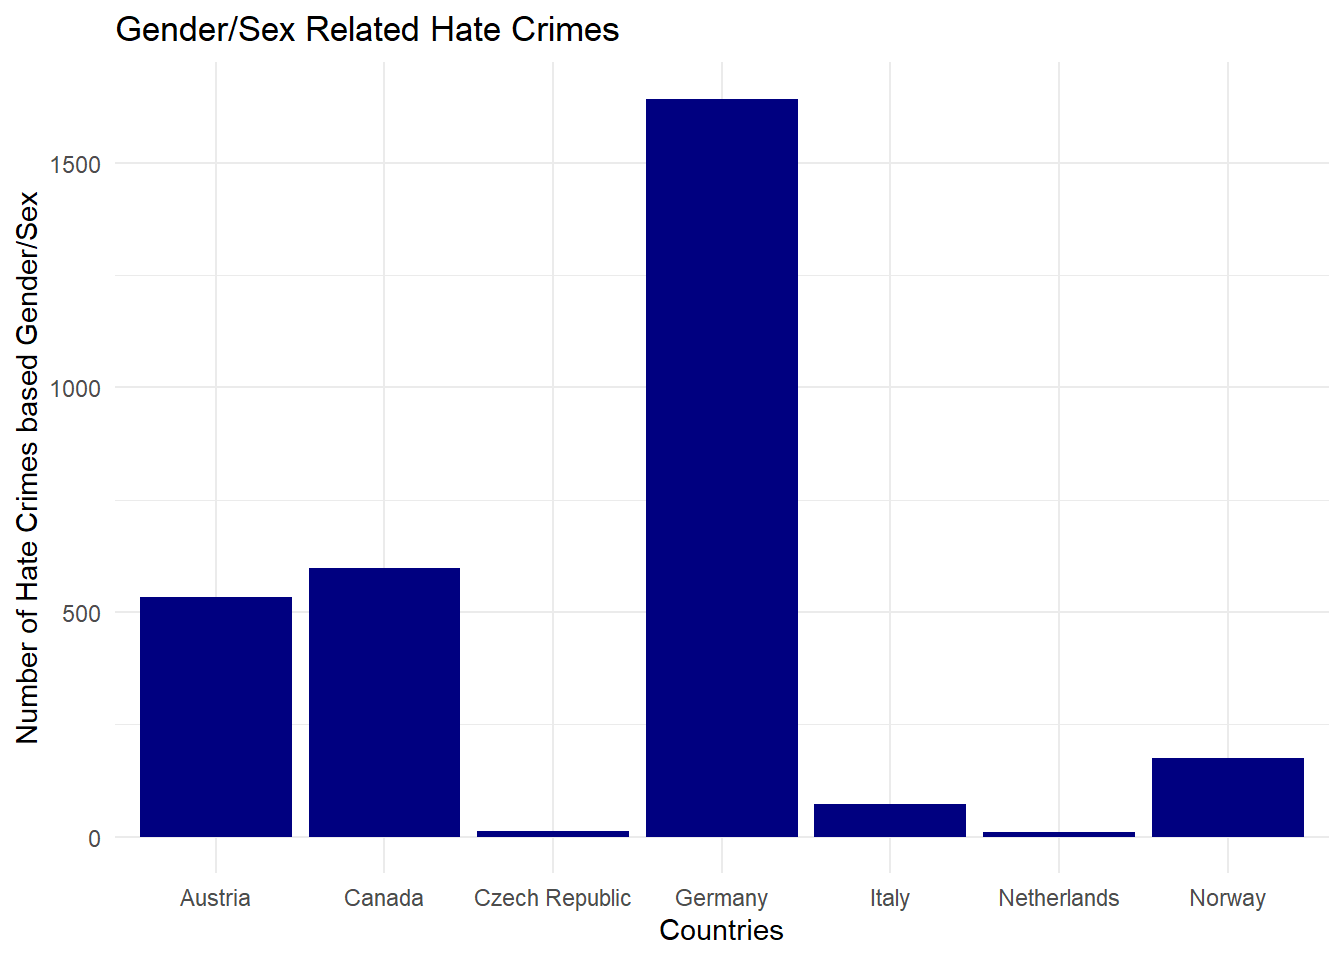
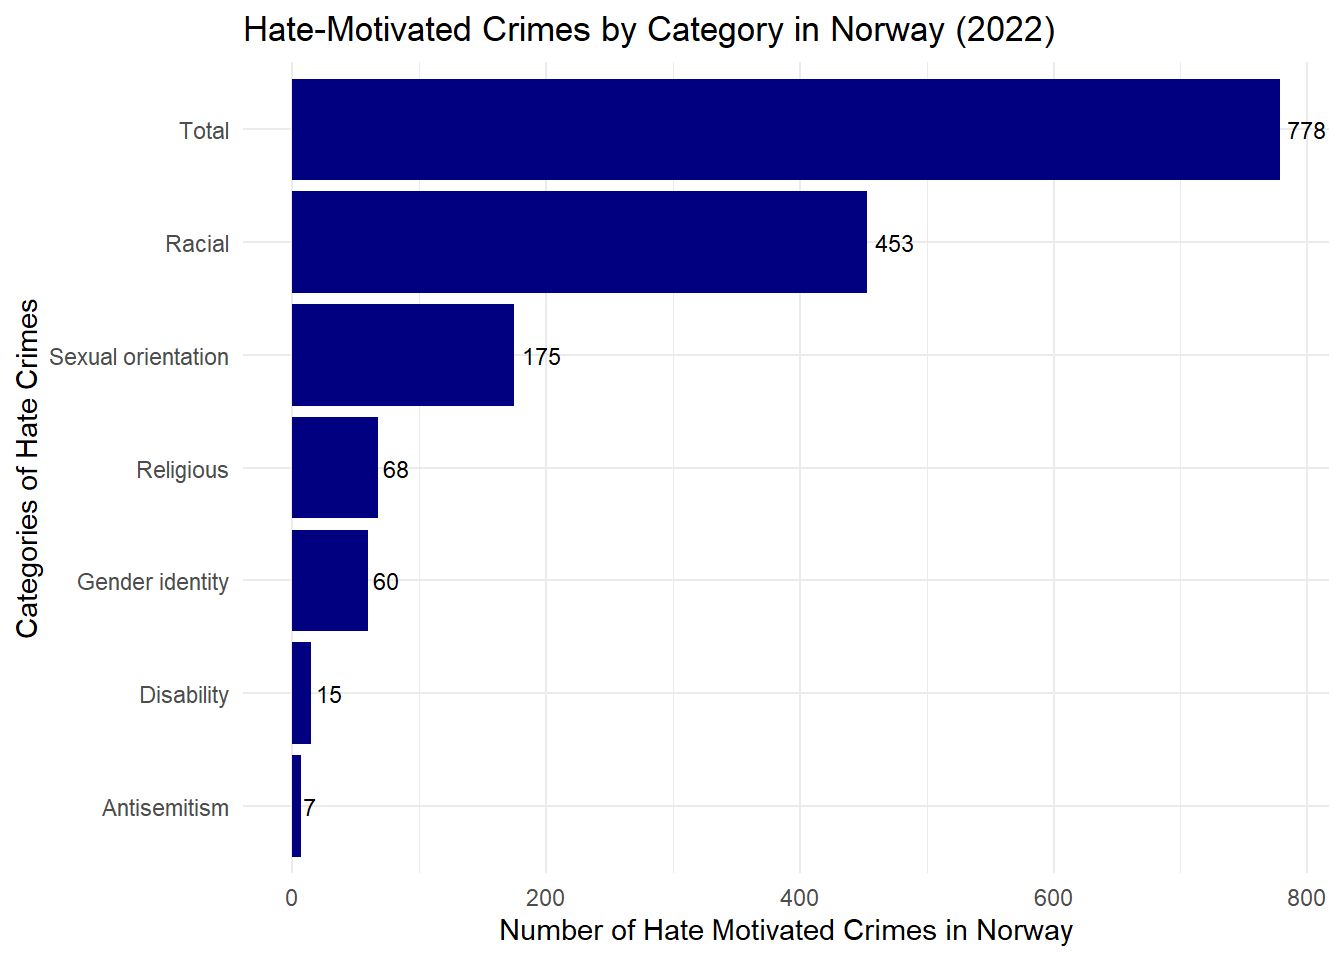
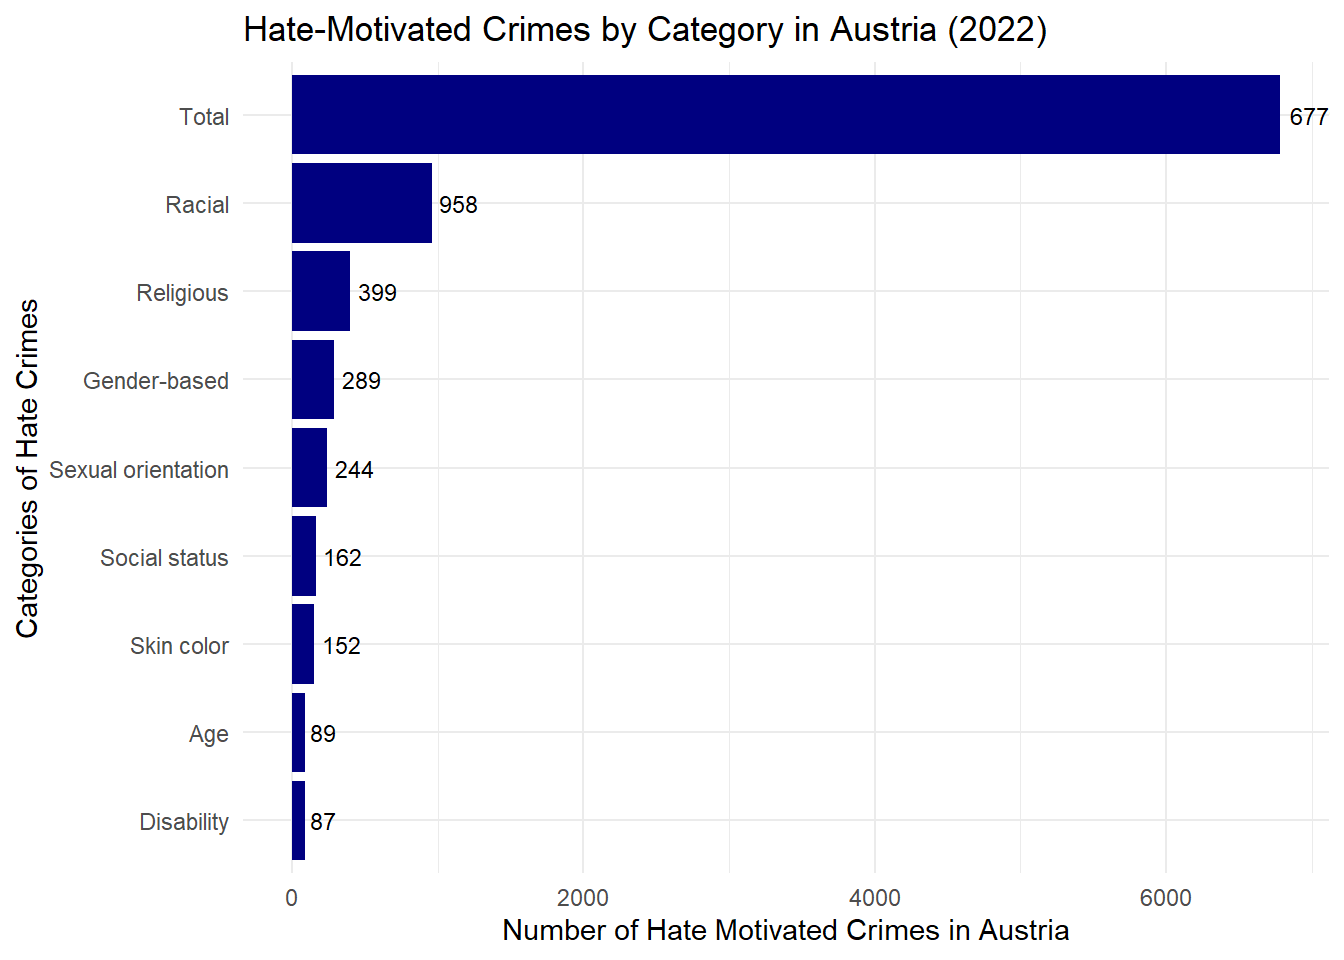
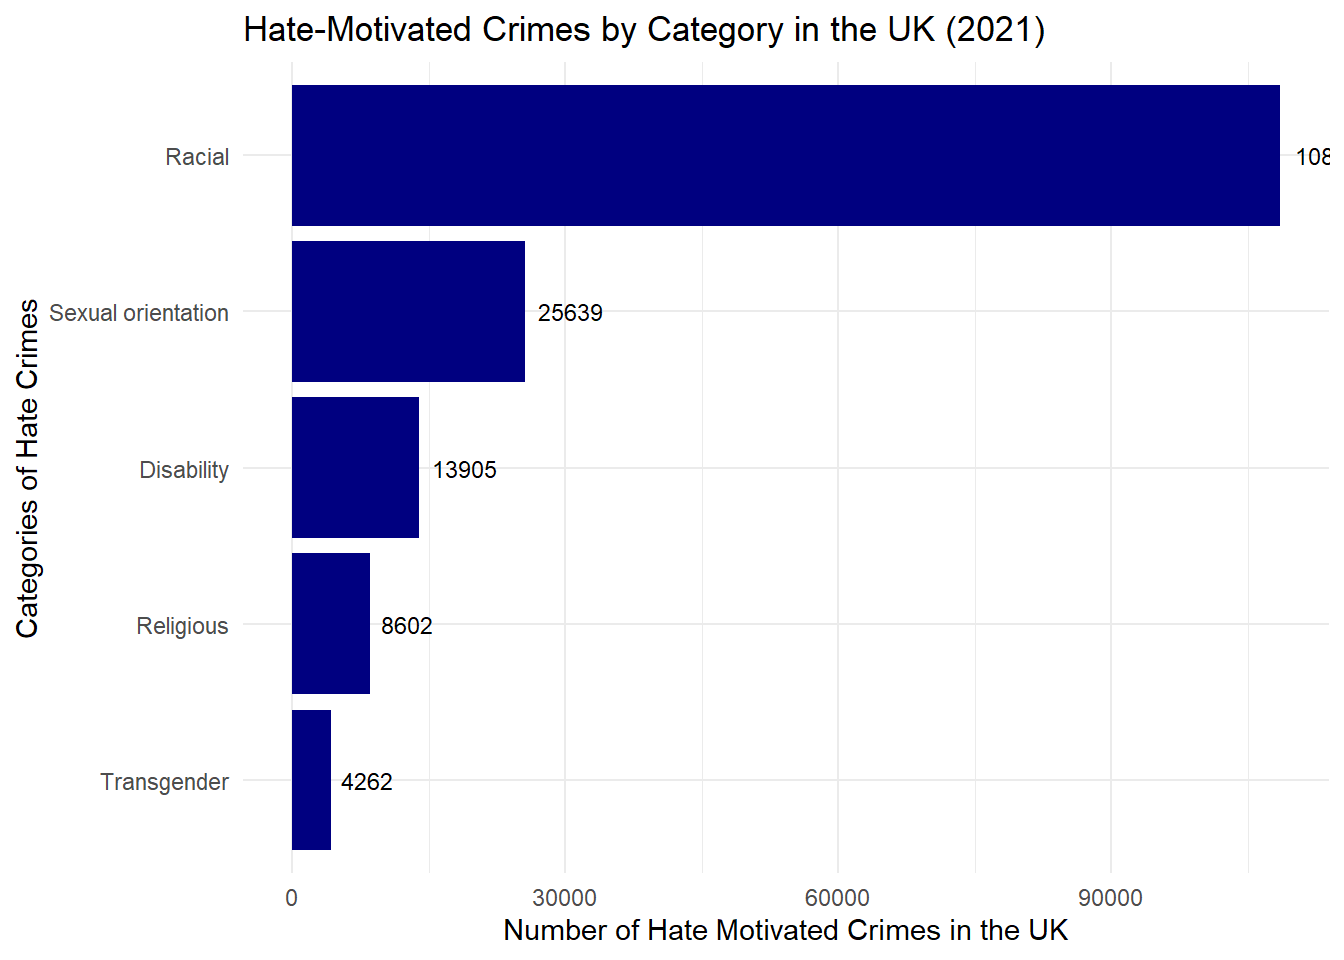
Country specific plots
Here, we zoom in a bit to identify more nuanced trends and issues of each country. It should be noted that not all the data allowed us to plot based on country. Only a few countries publish regular, clean, and reliable data regarding hate crime, which is a major obstacle.
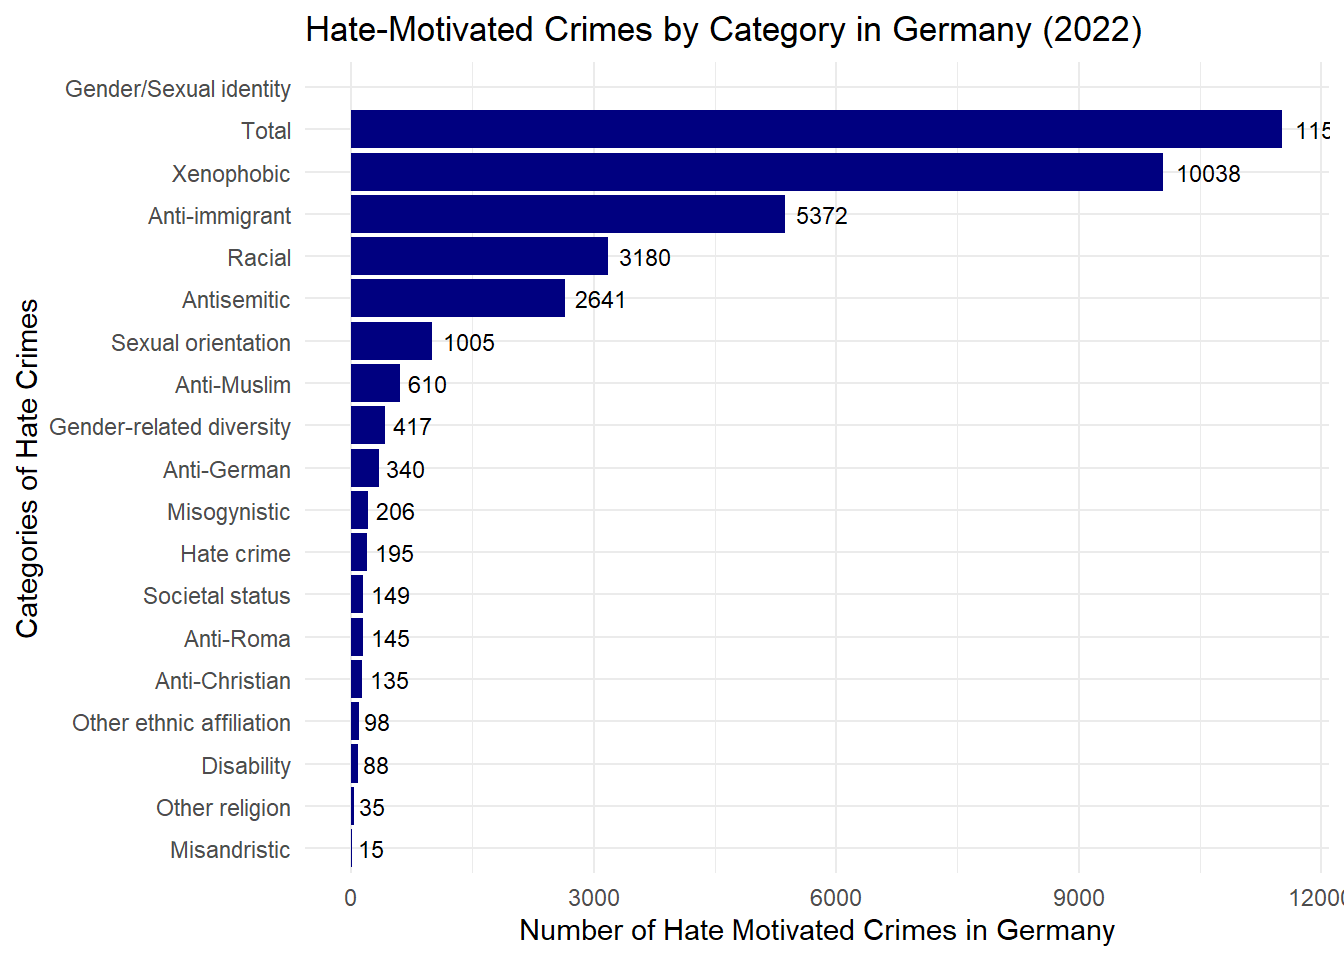
Hate-Motivated Crimes by Category in Germany (2022)
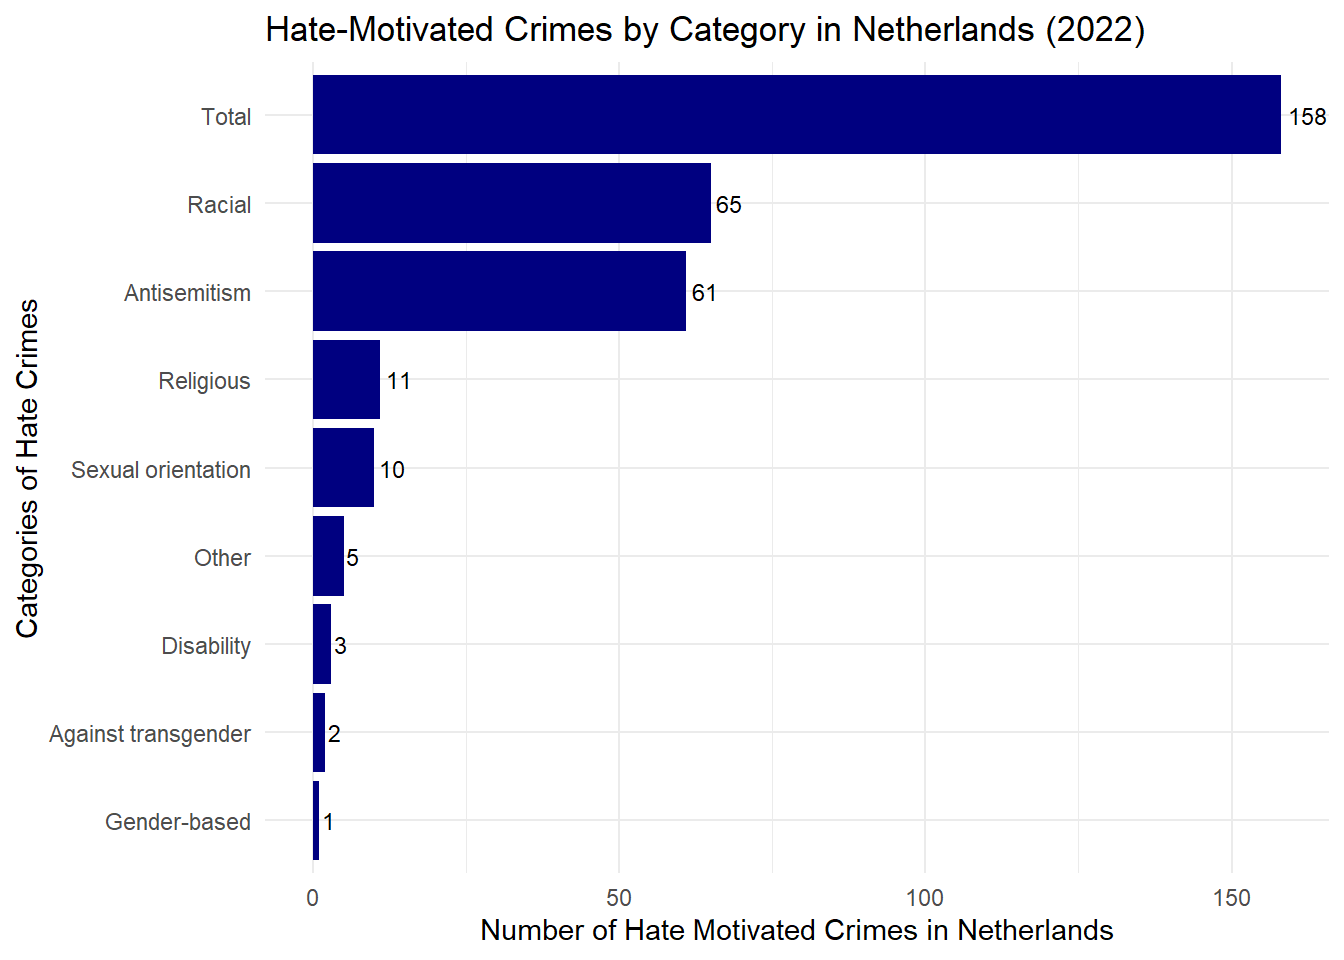
Hate-Motivated Crimes by Category in Netherlands (2022)
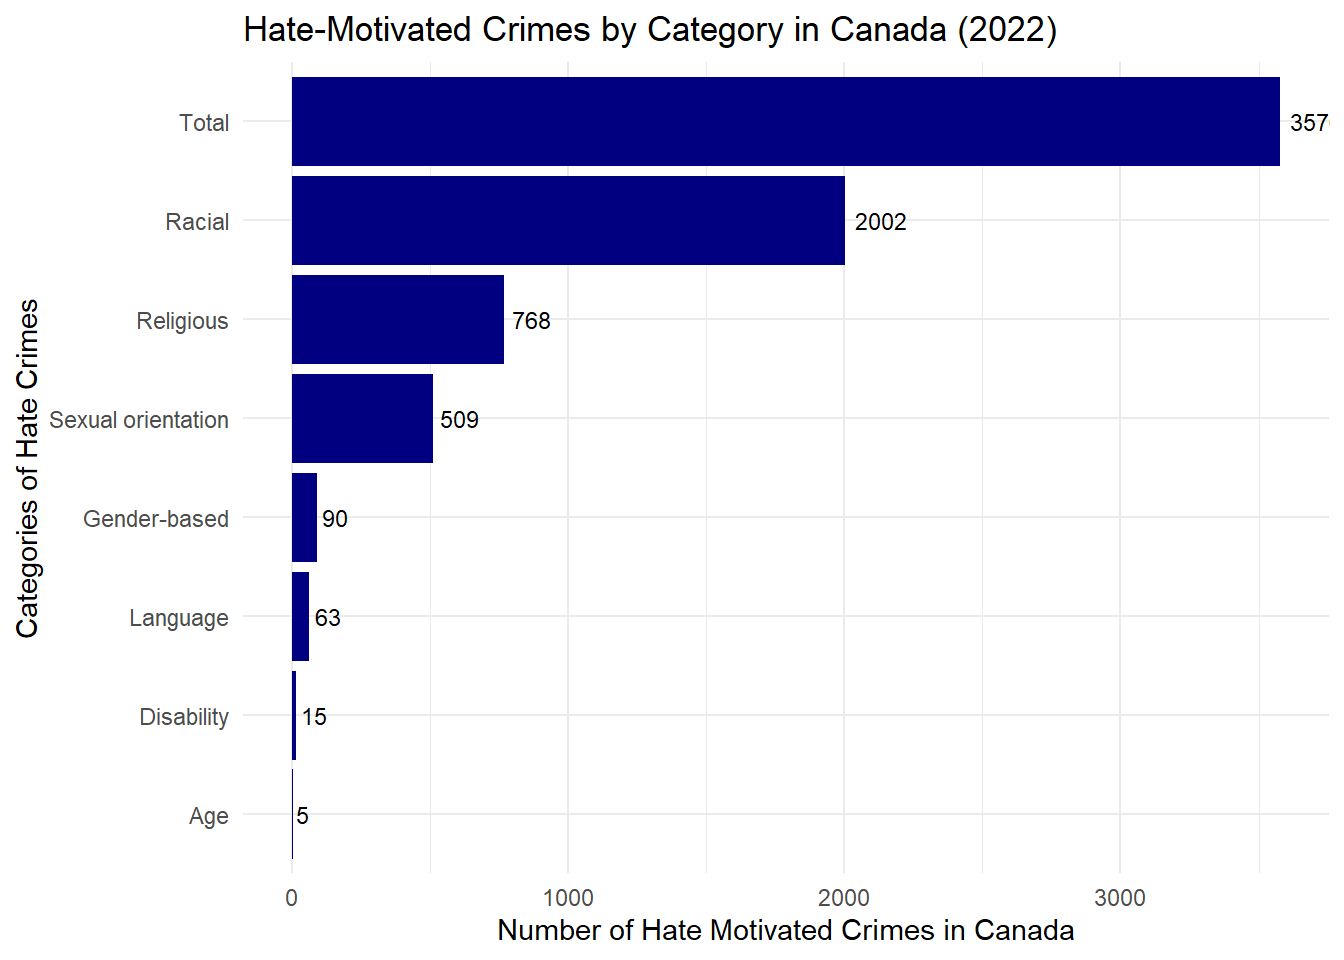
Hate-Motivated Crimes by Category in Canada (2022)
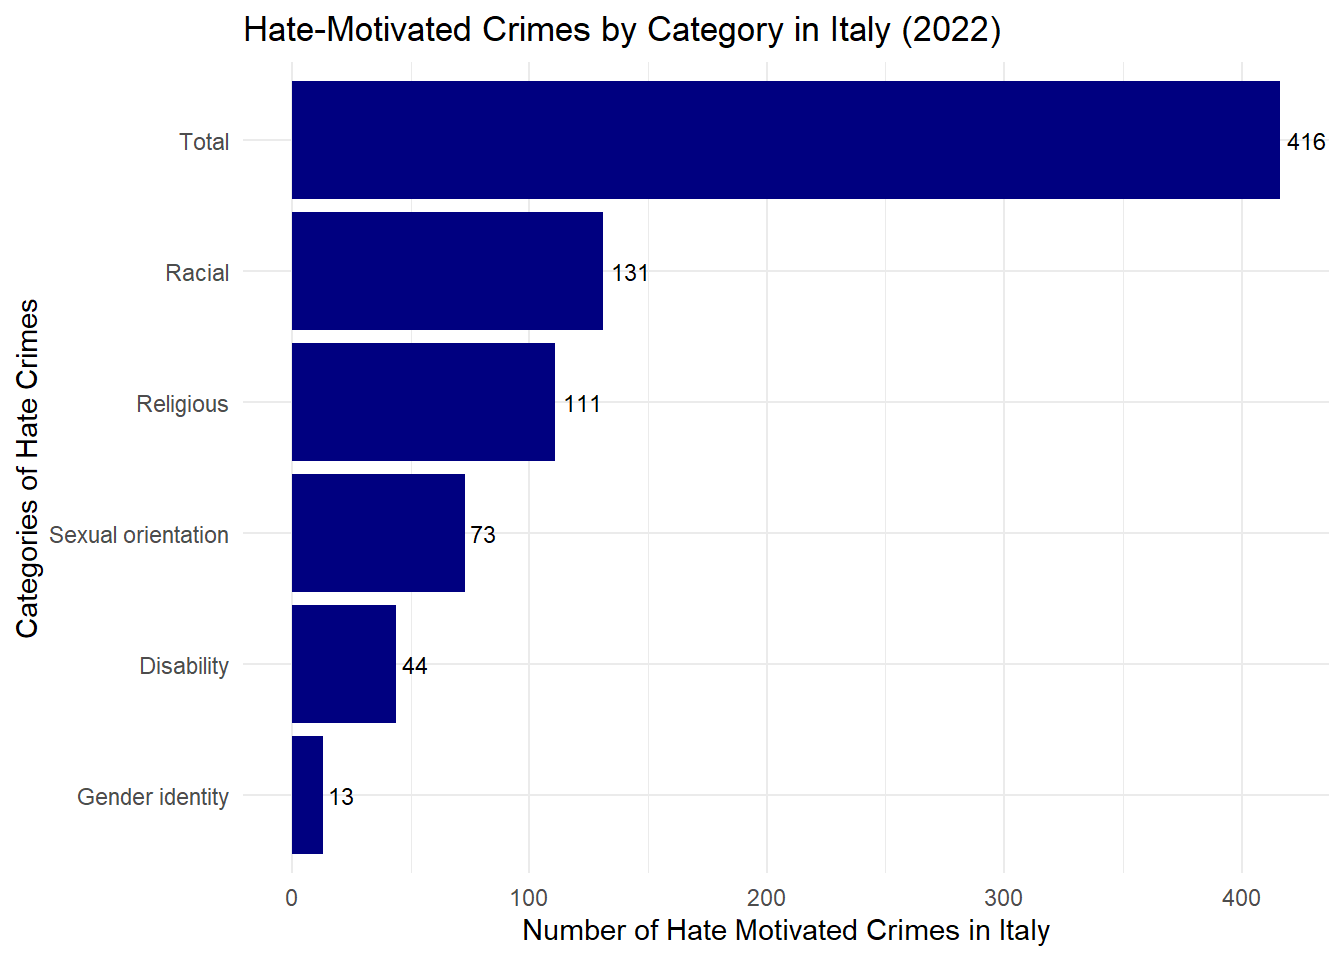
Hate-Motivated Crimes by Category in Italy (2022)
Hate-Motivated Crimes by Category in Norway (2022)
Hate-Motivated Crimes by Category in Austria (2022)
Hate-Motivated Crimes by Category in the UK (2021)
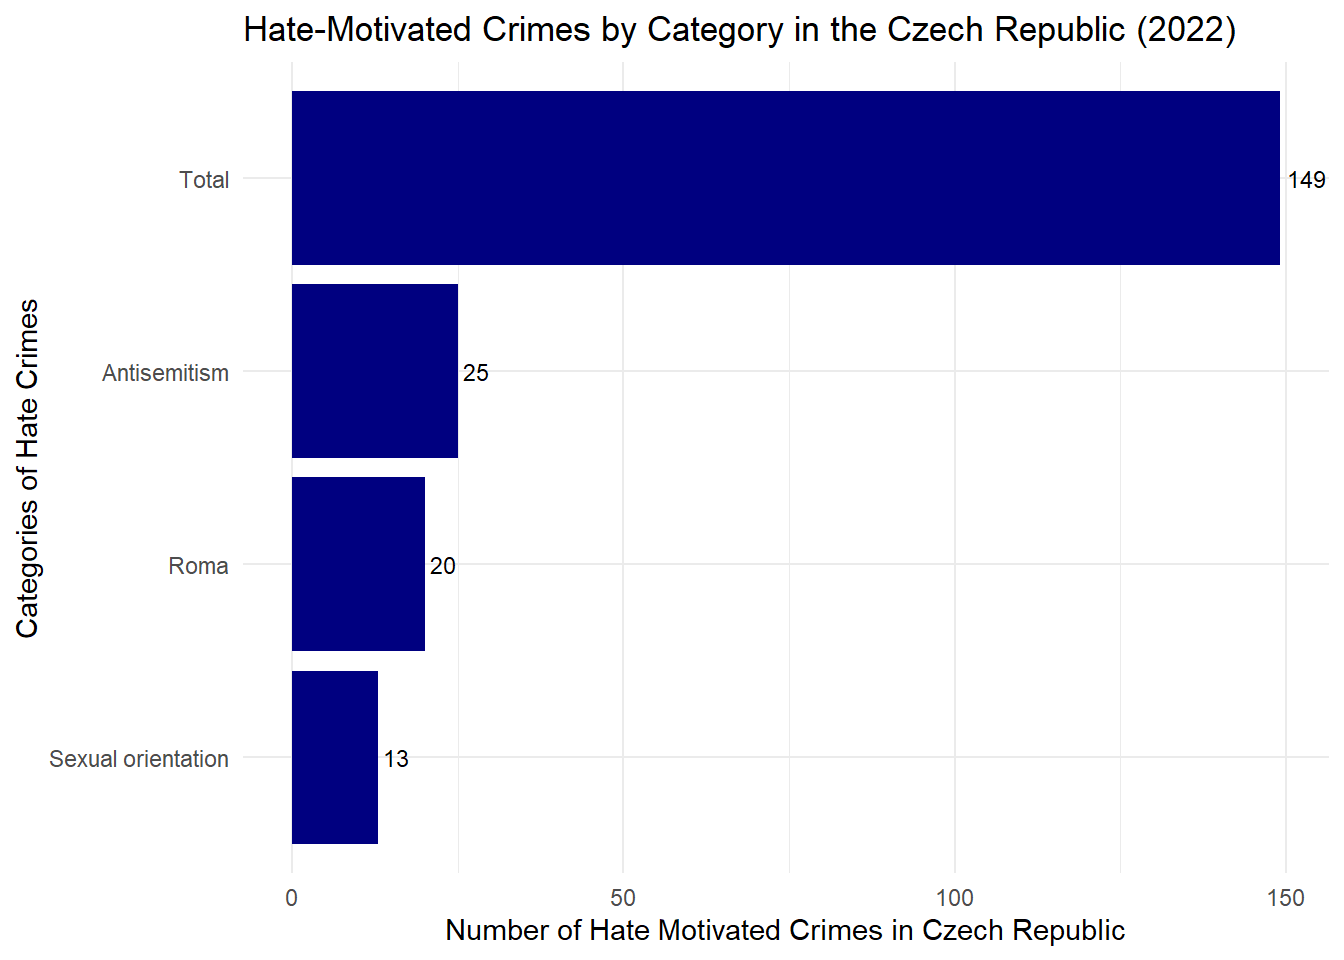
Hate-Motivated Crimes by Category in Czech Republic (2022)